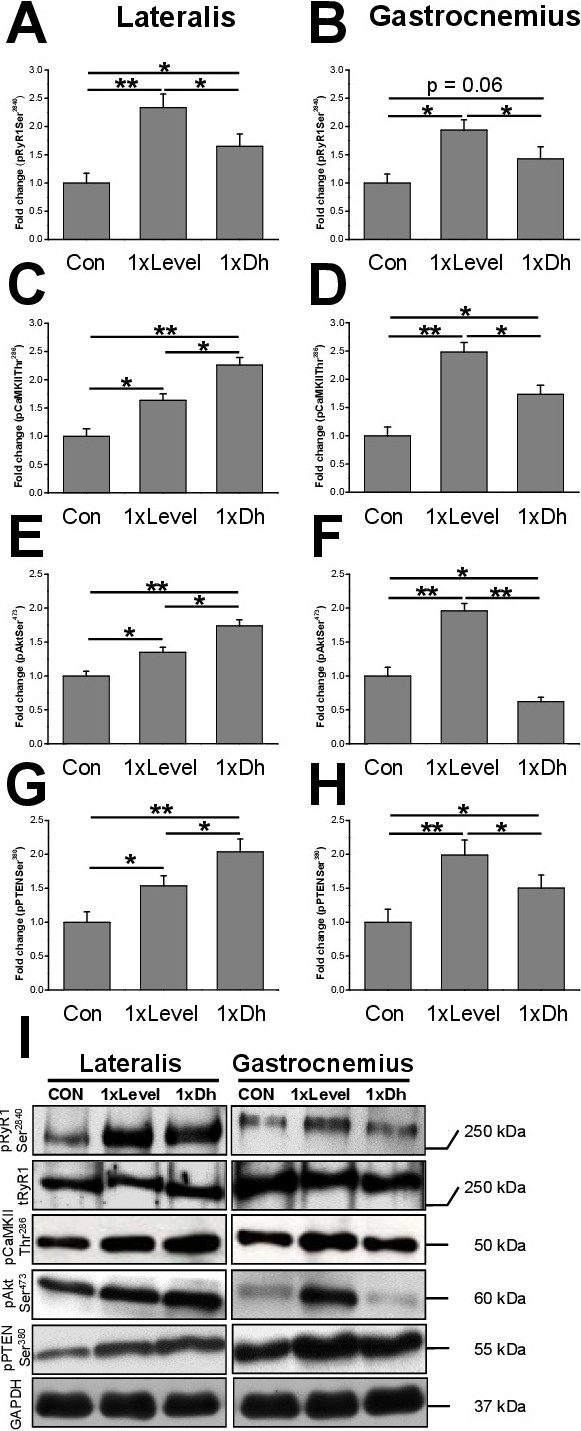
Fig. 3. Western blot analysis of RyR1 and signaling molecules in rat LAT and GAS muscles. Fold changes of pRyR1Ser2840 in LAT (A) and GAS (B) muscle upon 1xLevel and 1xDownhill compared to CON conditions show significantly elevated levels after acute exercise stimulations. Fold changes of pCaMKIIThr286 levels in LAT (C) and GAS (D) compared to CON show increased levels after acute exercise stimulations. Fold changes of pAktSer473 levels in LAT (E) and GAS (F) compared to CON. Fold changes of pPTENSer380 levels in LAT (G) and GAS (H) compared to CON show increased levels after acute exercise stimulations. Representative western blots of pRyR1Ser2840, total RyR1, pCaMKIIThr286, pAktSer473, PI3K, and pPTENSer380 as well as the internal loading control GAPDH are depicted in (I). * p<0.05, **p<0.01. n(western blot experiments) = 8 for each tested condition.